
Data & Geo Analytic, Data Visualization – Visual Analytic
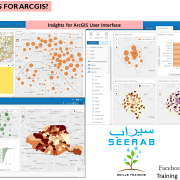
Insights for ArcGIS
Insights is an app that allows you to perform iterative and exploratory data analysis. With a drag-and-drop interface, you can answer questions with data from ArcGIS, Excel spreadsheets, and business databases.
Another notable development in ArcGIS 10.5 is the arrival in ArcGIS Enterprise of a new web application (premium) for exploring spatial and non-spatial data in your organization. Through user-friendly
Fully integrated with the ArcGIS platform, Insights can be accessed from your organization’s ArcGIS portal, allowing you to take advantage of geographic data in your GIS as well as other data sources in the company’s IT system (Excel Files, SQL Database. Explore, analyze, iterate in your layers and tables to reveal trends and phenomena in your data. Although Insights is an application running in a browser, it allows to work on very large datasets in a very efficient way.
In Insights, in a few clicks or by simple drag and drop, the user implements spatial or statistical analysis algorithms sometimes very complex. The multiple viewing options offered in Insights allow you to present your data in maps, diagrams, or tables through forms organized in a multi-page document. These can be saved and shared with other users on your ArcGIS portal. You can also share the workflow of your exploratory analysis to allow other users to replay it on other datasets.
Insights for ArcGIS is a Premium application integrated with ArcGIS Server 10.5.
Key Features
In Insights, you organize your work in workbooks, which can contain multiple pages. An Insights workbook is a new item type in your organization.
With an Insights workbook, you can do the following:
Learn new things … Stay tuned with Seerab : )
Insights
Power BI is a collection of software services, apps, and connectors that work together to turn your unrelated sources of data into coherent, visually immersive, and interactive insights. Whether your data is a simple Excel spreadsheet, or a collection of cloud-based and on-premises hybrid data warehouses, Power BI lets you easily connect to your data sources, visualize (or discover) what’s important, and share that with anyone or everyone you want.
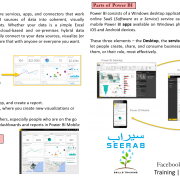
PARTS OF POWER BI
Power BI consists of a Windows desktop application called Power BI Desktop, an online SaaS (Software as a Service) service called the Power BI service, and mobile Power BI apps available on Windows phones and tablets, as well as for iOS and Android devices.
These three elements – the Desktop, the service, and Mobile – are designed to let people create, share, and consume business insights in the way that serves them, or their role, most effectively.
COMMON FLOW OF POWER BI
The common flow of activity in Power BI is the following:
BUILDING BLOCKS OF POWER BI
The basic building blocks in Power BI are the following:
Microsoft Power BI Desktop is free desktop application … Stay tuned with Seerab to learn more about BI, Analytics : )